Irrigation should be scheduled when soils reach 50% of the plant available water point and the amount of water should replenish the root zone to field capacity. The infiltration rate, effective root zone depth, and estimated ET demand determine irrigation frequency and soak cycle needs. Turfgrass species also affects irrigation frequency, since some turfgrasses more effectively resist drought than others.
Infiltration Rate
Infiltration rates depend on soil texture. Sandy soils have higher porosity and greater infiltration rates than silty or clayey soils. The matrix potential of the finer particle soils increases the time to wet the soil. The figure below shows the time and area wetted for two different soils: a 15 minute irrigation cycle on a sandy loam penetrates and wets to a depth of 12 inches and a 40 minute cycle wets nearly 36 inches of sandy loam, while clay loam soil requires hours of irrigation to wet the same profile.
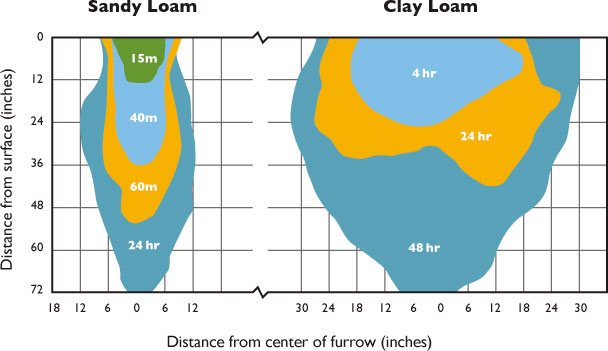
Infiltration of two different soil types measured in time and area wetted.
Soils develop unique characteristics called preferential flows that, in some cases, influence or accelerate flow through the profile downward towards groundwater. Examples of preferential flow are as follows:
- Macropores created by larger size particulate, gravel, or wormholes, create channels of preferential flow that direct water downward.
- Uneven mixes of soil types can result in veins of sandier soil that are more conductive than finer particle soils.
- Organic matter, organic residues, and subsurface layers of mixed densities may restrict and direct flow in unique patterns or fingers.
- Finger flow in sand, which acts like a large channel, allows water to rapidly flow through the profile along with any soluble compounds (fertilizer and pesticides).
- Hydrophobic soils repel water and thus the water must find another pathway, flowing (by runoff) towards areas that are wettable or into cracks in the soil.
Preferential flow and restrictions can lead to non-uniform moisture distribution in the root zone. Some areas of turf may be drier and other areas may be wetter, even saturated. Superintendents can develop better and uniform soil conditions by managing the soil compaction and organic matter content or thatch, such as by frequent aerification and top-dressing to provide better root-zone profiles. The use of water dispersants may be required to help water move through hydroscopic soil conditions associated with localized dry spot. Wetting agents, and in some cases organic amendments, may be needed to increase water holding capacity of some soils, particularly sandy soils.
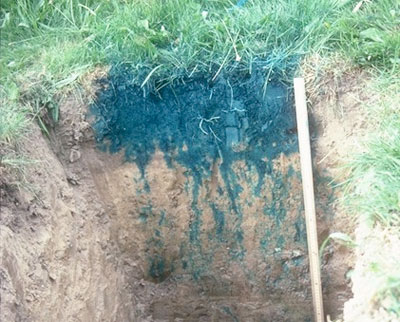 Preferential flow in soils. Source: Cornell, Soil & Water Lab.
Root Zone Depth
The depth of the root zone (the depth to which 90% of the root system penetrates) must be determined onsite with a soil probe or spade. The soil type and root zone depth together are used to estimate the soil water-holding reservoir available to the root system.
ET Demand
ET describes the water lost through soil evaporation and plant transpiration and is influenced by the climate conditions on any given day. Hot, windy days with low relative humidity have higher rates of ET than cooler calm days with low relative humidity. At the wilting point, ET has depleted the available water and the plant begins to show stress. Irrigation scheduling needs to periodically refill the soil reservoir to avoid wilting and can be scheduled by calculating the potential evapotranspiration (PET).
Calculating PET
The Northeast Regional Climate Center (NRCC) provides estimates of PET based on climate data from every regional airport in New York State. An ET rate of 0.20 is considered high. Conversely, an ET rate of 0.05 is considered moderate. Calculating PET requires a crop coefficient (Kc), which varies by plant species, the leaf area characteristics, and density of the canopy. The Kc typically used for turfgrass management is 0.80. PET estimates should be factored by the crop coefficient to calculate the water replacement to be scheduled.
PET x Kc = Adjusted PET for Turf
Precipitation – Adjusted PET for Turf = Water Deficit
In 2012, New York State experienced three successive seasons that challenged turf managers with very hot and dry periods. Using NRCC data, the 2012 PET deficit for each week is shown for Syracuse Hancock Airport in Figure 5-3. During the 2012 season, ET exceeded precipitation for 17 weeks, exposing turf to drought stress. The total deficit was 10.18 inches of water. Replacing 80% of the PET deficit would have used 11.9 million gallons of water to irrigate 54 acres, the average number of irrigated acres on an 18-hole golf course in the Northeast (Throssell et al 2009).
The NRCC provides historical data and ET forecasts at http://www.nrcc.cornell.edu/grass/.
Using PET
Information from onsite weather stations or PET data from the NECC can be used at a golf course scale or at a smaller scale to adjust for microclimates and conditions. Meaningful ET occurs from April through October in most cases in NY, so rainfall and ET is useful for this period. A few well-monitored golf courses in NY have demonstrated the importance of factoring in the soil water holding capacity to calculate the amount of irrigation. As shown in the figure below, the soil texture determines water supply and frequency of irrigation. For example, a typical 12 inch USGA sand root-zone green will have only about 0.75 inch of plant available water stored. Any daily rain events greater than 0.75 inch need to be reduced to 0.75 inch in the PET calculation (rainfall-ET). Also, to avoid drought stress in turf, irrigation should be at 50% of the PAW, or in the case of the sand green, about 0.20 inch of PET. On very dry days, this value could mean irrigating daily or every couple of days, depending on the weather. At the smaller scale, irrigation should be adjusted in areas with lower PET, such as shady areas. If an on-site weather station is not an option, at the least a rain gauge should be used to collect rainfall due to localized summer storms.
Monitoring Soil Moisture
The NRCS provides a guideline for estimating the soil moisture content of soil by touch. The turf industry, however, offers tools to more precisely measure soil moisture content. Several handheld and portable instruments can be used to spot check areas.
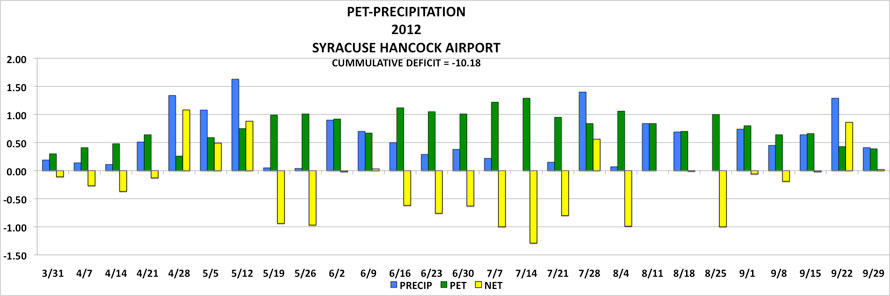 Cumulative weekly evapotranspiration deficit (Precipitation –PET) for Syracuse Hancock Airport, New York.
Programs are also available to map moisture content using global positioning system (GPS) positioning. Maps can be compared between different times of day, different seasons, and different management routines to compare soil moisture conditions. Irrigation system suppliers now offer in ground moisture meters to provide continuous data input to their controllers to adjust irrigation rates based on soil moisture.
Deep and Infrequent Versus Light and Frequent Irrigation
Several studies have compared deep and infrequent irrigation (DI) to light and frequent (LF) schedules. DI was applied at signs of wilting and the soil was wetted to a depth of 9.5 inches. LF treatments watered daily to replace the ET lost and generally wetted the top 1.5-3.0 inches of soil. Both treatments were syringed as required to cool turf on hot days. The turf treated using DI had increased root and leaf carbohydrates, larger and deeper root masses, reduced thatch, and better overall quality throughout the season (Fu, J., and Dernoeden, P. H. 2008; Fu, J., and Dernoeden, P. H. 2009a; Fu, J., and Dernoeden, P. H. 2009b). This particular study only considered physiological factors and did not assess the risks of leaching. Soils should not be wetted much below the root zone because this practice increases the risks of pushing nutrient and pesticide residues closer to groundwater.
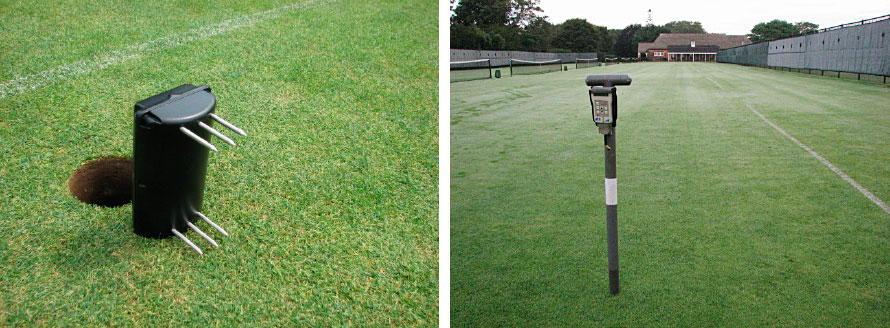 Root zone moisture,temperature, and salinity meter (left) and portable moisture meter (right). Source: John J. Genovesi, Maidstone Club
Other studies have demonstrated that turf pre-conditioned with deficit irrigation for a period of 7 to 14 days withstands periods of drought and has a quicker recovery. Pre-conditioning improves stomatal conductance, transpiration rates, and photosynthetic capacity in subsequent periods of stress. However, letting soils dry completely has a negative effect on plants. Creeping bentgrass, Perennial ryegrass, and tall fescue can be pre-conditioned replacing 60-80% of the water deficit. Kentucky bluegrass has much higher sensitivity to drought stress and should only be watered at 100% of deficit. Cool season turfgrass should not be watered below 40% of deficit. Even though Kentucky bluegrass has the greatest sensitivity to deficits, it has the highest resiliency to recover.