Blog

Welcome to the New York State Best Management Practices blog page. On this page we will be providing news, information, and insights on the use of Best Management Practices to protect natural resources. To be notified of new postings, please sign up using the form at right.

Spring ABW Management

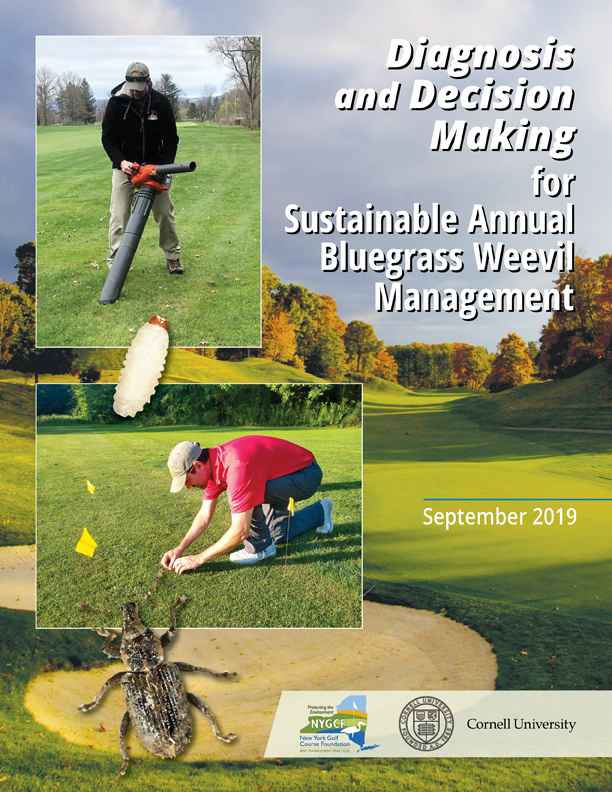
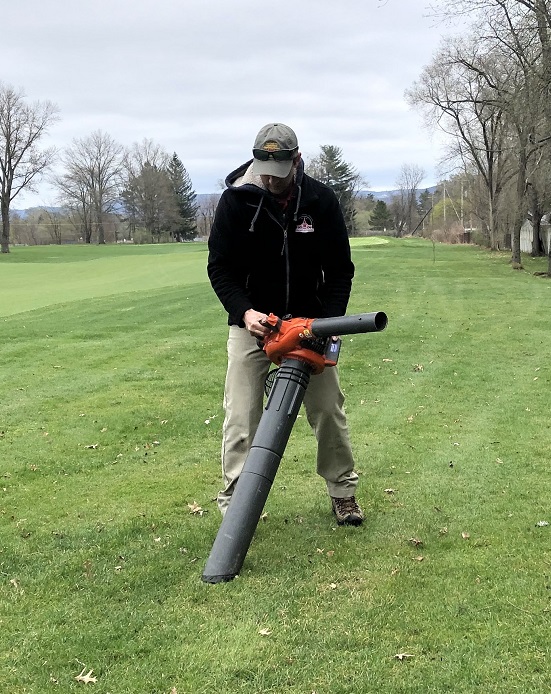
The annual bluegrass weevil (ABW), Listronotus maculicollis, can have two to three generations per year and cause significant damage to many golf courses in New York.  But monitoring and managing ABW in an economically and environmentally sustainable way can be difficult. However, by using proper scouting methods along with a well-informed decision-making process, you can improve the effectiveness and efficiency of ABW management at your facility.

ABW adults overwinter in leaf litter, tall grasses, and other areas with dense organic matter that provides a buffered environment from harsh winter conditions.  On a typical golf course, overwintering habitats include roughs, grassy native areas, forest edges, and tree and shrub lines. In spring — as early as March in upstate New York — ABW adults emerge from their overwintering areas and move toward golf turf playing areas to begin reproduction. This is when the ABW management season begins.

During the spring, ABW adults can be controlled before they lay eggs. Scouting for adult ABW is important for decision-making, with the primary goals for adult scouting being to determine the following:

  • Timing and location of ABW emerging from overwintering sites — when and where on each course. Recording these location helps to narrow scouting efforts later in the season.
  • Pattern of ABW adult movement following emergence toward short-mown turf.
  • Timing of peak activity of ABW adults, meaning the point at which the majority of ABW adults are found at or within the playing surface (fairway, tee, green) edge.

Adult scouting should begin in March and continue weekly until peak activity is observed at the nearest playing surface and noted. This stage generally coincides with the phenological stage of half green/ half gold on forsythia and occurs at roughly 110 – 120 growing degree days (GDD – base 50 beginning March 1). This will also highlight areas for larval monitoring later in the season.

To learn more about scouting and ABW management, see our new video “Scouting & Decision Making for Annual Bluegrass Weevil” featuring the work of Dr. Kyle Wickings, Cornell University, and funded by a Turfgrass Environmental Stewardship Fund grant. This video is a companion to our ABW publication Diagnosis and Decision Making for Sustainable Annual Bluegrass Weevil Management.

Water Sampling Using “Wave”:

Guest blog post by Matt Ceplo, Rockland Country Club Golf Course

Do you have a stream on your golf course property? Interested in a way to measure water quality without spending a lot on costly testing, learn a thing or two and have some fun at the same time?  One method is to examine what is living in it – in particular the benthic macroinvertebrates. These insects live underwater in our streams and rivers, lack a backbone, and can be seen by the naked eye.

The NYSDEC program called WAVE (Water Assessments by Volunteer Evaluators) is a project where volunteers collect, or sample “stream bugs” to assess water quality in wadeable streams throughout New York State.  These organisms are the “canaries in the coal mine” that can be used to assess stream health. I remember attending my first sampling day and found it to be extremely fascinating. Finding out what “bugs” are actually living in our streams was a real eye-opener. Like a lot of things in our lives, it’s not difficult to get a basic understanding of how to find and identify benthic macroinvertebrates, though being an expert could take a lifetime of study.

The good news is that help is available to use this method to sample and assess water quality. The WAVE program holds training classes, both in person and on-line. My training was sponsored by the Rockland County Soil & Water Conservation District. Alternatively, volunteers may already be in your area that you can request assistance from for stream sampling at your facility, if you have an appropriate sampling site. To qualify as an official sampling site, certain stream characteristics must be present. For example, your stream must have an active riffle habitat (a place where water flows over rocks). On the other hand, if your stream is near the outfall of a pond it may not qualify.

Using this method, stream invertebrates are collected and identified. This information is assessed with respect to diversity (how many different species are present) and sensitivity to pollution. For example, some species are sensitive to stream water quality conditions – meaning they require high dissolved oxygen levels, or clear, nonturbid waters, or they may be predators that require an ample source of prey. Some species are moderately sensitive to stream water quality conditions, meaning they can survive in conditions that sensitive species may not, though they still need a supportive aquatic environment to survive. And last, some species are pollution tolerant, meaning they can survive in poor water quality such as waters with low levels of dissolved oxygen, turbid waters or nutrient-enriched waters.

Once your sample is analyzed it will be recorded as “possibly impaired”, “not impaired”, or “No conclusion”.   The sites that are “possibly impaired” are flagged for further professional level study by the NYS DEC and added to their RIBS Program. A stream that has a poor water quality score over time can qualify them to be added to the Priority Waterbodies Inventory, which makes the site eligible for grant funding for restoration.  More information on the WAVE program and links to on-line training, sampling guides and forms, etc. can be found the WAVE web page on NYSDEC’s website.

You may be surprised where sampling is already being conducted. It may be a location close to your golf course, in which case that data may be useful to use as you review your water quality practices and management efforts.

Sustainable Annual Bluegrass Weevil Management: Yes, It’s Possible.

For many reasons, management of annual bluegrass weevils (ABW) presents incredible challenges to golf course superintendents in New York State. These reasons include:

1) The small size (about 1/8 inch in length) and cryptic nature of ABW adults make monitoring difficult.

2) As the life stages progress and ABW transitions through the egg and larval stages, observing ABW becomes increasingly difficult because most stages occur within the turfgrass stem. Complicating things further, as larvae mature they emerge from the turf crown into the surrounding soil and proceed to feed on the crown and roots of the plant. Following the last larval development stage, larvae pupate below ground and the next adult generation emerges. This generation of ABW is more widely distributed on the golf course, and thus more difficult to find and diagnose than the previous generation.

3) ABW development is highly asynchronous, meaning that the life stages of different individuals overlap, resulting in the presence of more than one life stage at a single time.

Collectively, these factors make ABW a difficult insect to monitor and manage in an economically and environmentally sustainable way. However, by using proper scouting methods along with a well-informed decision-making process, the effectiveness and efficiency of ABW management can be improved at your facility. Traditionally, ABW management has focused primarily on scouting for and treating adults. However, to enhance control and to manage insecticide resistance in ABW, managers are encouraged to broaden their monitoring and management efforts to include ABW larvae in addition to adults.

The new NYS BMP and Cornell University joint publication Diagnosis and Decision Making for Sustainable Annual Bluegrass Weevil Management provides the information superintendents need to establish a successful ABW monitoring and management program for both adult and larvae ABW.

Related content on the NYS BMP blog:

  • Case Study on IPM Methods to Control ABW at Bethpage Black Course
  • Detailed instructions on two different designs for easily creating a vacuum basket for monitoring ABW.

Adapting BMPs to Fit Your Facility

Through a cooperative approach between the golf industry and friends and neighbors outside the industry, best management practices have been developed that benefit all parties. Because of limitations, such as budget, staff, clientele expectations, and management decisions, not all golf courses can achieve all of the best practices described in the 2nd edition of Best Management Practices for New York State Golf Courses. However, planning for improvements over time and making small changes that meet the goals of BMPs can be achieved.

For example, while a sophisticated washwater recycling system may be too expensive for many facilities, blowing clippings off mowers onto a grassed surface is easily achieved and markedly reduces the amount of nitrogen and phosphorus in clippings that end up in washwater. With a bit more of a budget, facilities can utilize the information from the NYS BMP case study on a proto type low cost wash operation that protects water quality at Locust Hill Golf Club in Rochester. Additional case studies of BMPs implemented on golf courses in the state can be found in the Case Studies section of this website.

To adapt BMPs to an individual facility, superintendents should assess their individual site, consider their available resources (such as budget), and understand that implementing BMPs will be an on-going process. In addition, superintendents should consider multiple approaches to achieving BMP goals that can successfully protect natural resources. For example, the following describes an incremental approach to developing a nutrient management program, as published in a previous blog post “Assess and Map Your Soils” and our new publication Nutrient Management Planning for New York State Golf Courses:

  • A good practice is to assess the chemical and physical analysis of your regularly fertilized soils using a Minimum Level for Sustainable Nutrition (MLSN) Guideline interpretation, as well as looking at overall turf quality and growth, when developing a nutrient management program. Make accurate supplemental nutrient applications to targeted areas of established need.
  • A better practice is to use the Web Soil Survey as a guide to classify and sample all soils on the property using the MLSN interpretation and performance variables (quality and growth). Make supplemental applications of nutrients based on large-scale mapping in targeted areas of well-established needs.
  • The best practice would be to implement a Web Soil Survey-driven sampling program and use appropriate interpretation and performance variables as layers in a GIS database built from the sampling locations. Use this GIS database of soil properties for GPS-based Variable Rate Application equipment for precise supplemental nutrient applications to targeted areas of well-established need.

For more information on how to start your own facility BMP using the GCSAA on-line tool, see our previous blog post on creating a facility BMP.

New York Superintedents: How to Create Your Own Facility BMP

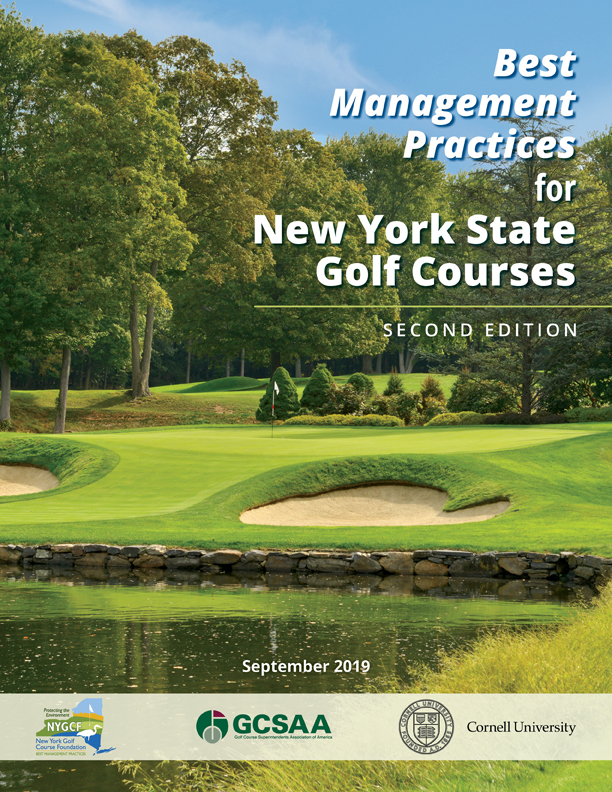
Golf course superintendents in New York State can now create their own facility-specific Best Management Practices plan using the 2nd edition of the Best Management Practices for New York State Golf Courses template.

This 2nd edition, a revised, updated version of the first edition published in 2014, is incorporated into the GCSAA’s BMP on-line tool. Using the on-line tool, New York superintendents with a GCSAA log in can clone the state’s BMP plan and then use the editing features to modify as needed to create their own site-specific BMP plan.

To help get superintendents started, the following are available:

1) You will need to log in. Need help with your password? Find password information here: Facility BMP Password Help (pdf).

2) You will need to access the facility tool at https://facilitybmp.gcsaa.org/. A set-by-step guide to accessing the tool and starting your facility BMP are available here: Facility BMP How To Guide (pdf).

3) Need more detailed help with the facility BMP process? GCSAA has a pre-recorded webinar that provides information on the features of the tool and how to use them to create a facility BMP.

In addition, the New York Golf Course Foundation will be hosting workshops to assist superintendents in these efforts, with one at the Central New York conference on February 13th in Rochester. More workshops are planned in several locations next winter, depending upon the availability of funding. These workshops will be announced on this website and NYGCF’s Twitter feed.

Problem Solving Using Water Monitoring

Guest blog post by Mike Brunelle, CGCS, Upper Montclair Country Club in Clifton, NJ

As a property that is pinched between two major highways in the NY/NJ metropolitan area, we constantly see expected and unexpected things show up in our bodies of water carried by surface water runoff. Our ponds were experiencing an algal build up and blooms in the warm months and we wanted to know – were we causing the problem or was it originating off site? Therefore, we began testing our surface waters to quantify the nutrient load as it entered and departed our property to answer the question.

Around the same time, we began experiencing odor problems from low lying areas that acted as collection points for surface runoff, accumulating silt deposits and leaves. But the odor coming from these areas could not be explained by decomposition of organic matter alone. We tested water in these areas and saw spikes in the total nitrogen levels. But as the problem worsened, we decided to also test for fecal coliform. This testing found levels at about 12,000 fecal colonies/100 mL of water tested; this compares to a regulatory requirement of 200 or less fecal colonies/mL allowed for swimming. Therefore, we used our test results to inform the neighboring town north of the property that the issue was coming from upstream and not originating from our property. The town’s resulting inspection of the upstream drainage flowing into the property determined that a concrete drain pipe crossing under the town sewer line had been compromised, resulting in a leak that drained onto our property. This is a case and point of the saying “s**t flows downstream”.

Stormwater Management: a Win-Win Effort at Brae Burn

Guest blog post by Blake Halderman, CGCS, Brae Burn Country Club in Purchase, NY

When evaluating your property, don’t just focus on the grass. It’s important to think about all areas of your property that might be affecting the results you are trying to achieve!

ISSUE –  Runoff from Highway 684 caused flooding of the 7th fairway on a regular basis, bringing along with it dirt, other debris, and contaminated water.

RESOLUTION – Create a “retention area” to capture the first flush of rainfall as to not overtax the piping system on the golf course until most of the water can subside after rainfall events. This area has been recently seeded as well to act as a filtering device in the future. We installed an overflow device (elevated pipe with top 1 foot below the ridge of the burn) with low flow holes  which allow the water to enter the pipe in a controlled manner. If water goes above the holes, it will enter the top of the pipe. If the volume of water is greater still, then we have installed a rock swale with two additional drains to hopefully capture the water before it reaches the fairway surface.

RESULTS –  The retention area alone holds enough water so that it barely enters the lowest holes 99% of the time. Eventually, the water infiltrates into the ground before the next rainfall event. As a result of these efforts, the fairway is much more playable. In addition, the runoff originating from the highway (oils, salts, etc.) is filtered in the retention area, and the decrease in stormwater runoff volume across the fairway reduces the potential for the runoff to pickup nutrients and pesticides from the turf surface and transport them to surface waters.

TOTAL COST – Less than $500. Material costs included a couple pieces of 12” pipe, 1 piece of 18”pipe for the risers and 3 grates.

Late Season Nutrient BMP: Timing is Everything

Supplemental nutrient use is a critical aspect of a golf course Best Management Practice Program and embodied in the BMP Statement:

Supplement soil with appropriate rate and source of nutrients to maintain optimum availability and minimize off-site movement.

Specifically, the application of high rates (>0.5 lbs. actual Nitrogen per 1000 Square feet) soluble-Nitrogen (N) during cooler periods with less active growth conditions pose a significant risk to groundwater quality.

In the Northeast, Guillard and Kopp (2004) from the University of Connecticut collected leachate under turf plots over three years where 1 lb of N per thousand square feet as ammonium nitrate or polymer coated urea was applied annually at four different times (Figure 1).

Figure 1

First, the data demonstrate that leaching of applied N occurs primarily in late-fall to early spring in southern New England and applications of soluble N later in the season result in greater leaching. Polymer coated N had less than 2% in leachate over three years. However, there is no question that late season soluble nitrogen applications to cool season golf turf have well-established benefits:

  • stimulating growth during cooler conditions
  • aids in recovery from summer stress
  • prepares the plants for maximum winter-hardiness

Of course, the latter benefit is critical to good spring golfing conditions, especially when spring golf traffic requires active growth as temperatures allow.

To quantify active growth use clipping volume as a measure of growth and the Growth Potential Model, as described thoroughly by Dr. Micah Woods in the 2013 article Using Temperature to Predict Turfgrass Growth Potential
(GP) and to Estimate Turfgrass Nitrogen Use
. This model simply provides an overview for the amount of growth that could occur compared to maximum growth potential and can assist with moderating N applications throughout the season.

Specific turfgrass research conducted by Professor Doug Soldat in Wisconsin over a three-year period concluded that applications of soluble N made in late October and November resulted in significantly less N in the plant tissue (roots and shoots) (Figure 2). Clearly if you are applying fertilizer when growth potential is less than 20% the risk of N loss increases.

Figure 2

To conclude, the following are good, better and best practices for sand-based soils (higher risk):

A good practice is continue to spoon-feed (generally rates at or below 0.2 lbs N per thousand square feet) soluble nitrogen sources into the fall. Gradually reduce nitrogen rate as evapotranspiration rate declines. Final application should be made from early to late October depending on your location.

A better practice is to monitor growth potential and clipping volume and spoon-feed (generally rates at or below 0.2 lbs N per thousand square feet) soluble nitrogen sources into the fall. Gradually reduce nitrogen rate as evapotranspiration rate declines. Final application should be made from early to late October depending on your location.

The best practice is monitor the aforementioned parameters and evapotranspiration levels and occasionally monitor plant tissue uptake and spoon-feed (generally rates at or below 0.2 lbs N per thousand square feet) soluble nitrogen sources into the fall. Gradually reduce nitrogen rate as evapotranspiration rate declines. Final application should be made from early to late October depending on your location.

For native soils or for alternatives to spoon-feeding consider the use of slow release N sources in mid-September at 0.5 to 1.0 lbs per thousand square feet. Products should have at least 50% slow release nitrogen or less. Applications made too late will risk leaching or lingering in the soil and promoting excessive spring growth that could reduce summer stress tolerance.


Pollinator BMPs: Updates!

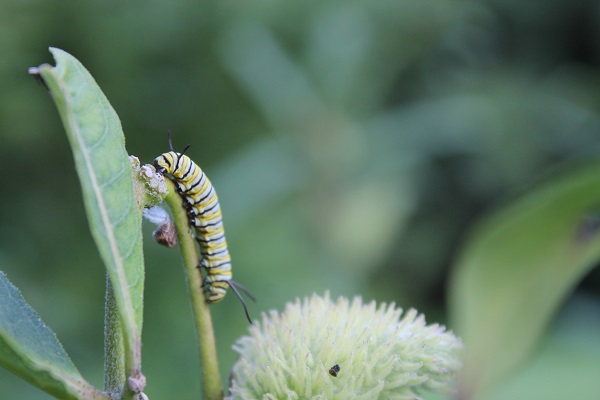
Our stand alone publication, Best Management Practices for Pollinators on New York State Golf Courses, has been revised and republished, now available for on-line reading as a flip book: https://nygcf.com/nysgolfbmp_com/nys_pollinator_bmps_2019/.

Over 400 wild species of pollinators inhabit New York State. Golf courses, especially in developed areas, can provide significant areas of habitat to support these species and domesticated honey bees as well. This publication contains the information superintendents need to protect pollinators while responsibly using  pesticides to meet their needs and guidance on providing habitat to support healthy pollinator populations.

What Good is the EIQ?

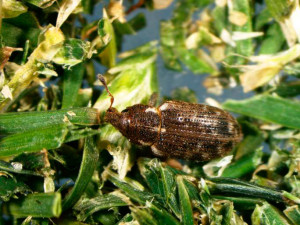
Pest management is a critical component of maintaining a playable and functional golf course. A fully implemented best management practices program demands the highest level of progressive Integrated Pest Management (IPM).

Progressive IPM observes and records pest pressure, uses predictive approaches to assessing injury risk, considers intervention with lowest environmental impact, and assesses performance of intervention for integration in pest management programs. This summer, when you consider intervention to control pests that includes the use of pesticides, consider products with the lowest environmental impact. This idea is identified in the two BMP statements:

Determine least toxic pest control programs including preventive approaches.

Recognize environmental fate of pesticides and select pesticides using a selection strategy that includes an evaluation of pesticide characteristics and potential for nontarget effects.

When pesticide use is warranted, the selection of pesticide should include an evaluation of economics, efficacy, and the environment. An additional factor such as application method should be considered as well in those cases where liquid spray is more effective than granular products or has a lower environmental impact.

A simple method to assess the reduction in environmental impact can be performed by simply calculating the pounds of active ingredients of products used and striving each year to reduce those totals. However, this simple method neglects any potential variability in toxicity, which could be accounted for by using a percentage of reduced risk or biological products for pest control.

A number of pesticide risk assessment models are available from a variety of government, university and private sources to use for more precise environmental impact estimations. These models utilize toxicity, exposure, and persistence data to provide a numerical value that integrates a number of human health and environmental impacts. For example, the Quebec Pesticide Risk Indicator (QPRI) has different assessment models for human health (QPRI-Health) and a separate number for environmental impacts (QPRI-Environment). These measure various factors and provide the user information for product selection and cumulative environmental impact during a season.

The Cornell Turfgrass Program uses the Environmental Impact Quotient developed by the NYS IPM Program and adapted for use in turfgrass systems. Like the QPRI, the EIQ assesses the toxicity for the applicator and golfer as well as environmental fate and persistence characteristics. A numerical value is determined for a product, then adjusted for field use rate and finally the treated acreage.

Both these approaches have limitations; however, over time, regardless of the tool used, it is critical to attempt to measure and monitor the risk associated with pest management programs.

An excellent example of the risk assessment approach is available in the Case Studies section of this website, in the Reducing the Environmental Impact of Pest Management case study at Soaring Eagles Golf Course. The golf course management staff at Soaring Eagles Golf Course implemented the EIQ approach over a five-year period to target reducing risk associated with pest management and specifically with dollar spot control.  The case study concluded the following:

“Soaring Eagles quickly adapted the chemical substitutions of lower FUEIQ products with the same or improved efficacies, still considering resistance management. Strategic equipment investment created opportunity for specific cultural operations that directly reduced pest pressure and improve plant vigor. Five years later, there is a 28 percent reduction in the overall FUEIQ –Acres. More significantly, the course has reduced the use of higher FUEIQ-value chemicals by 57%.”

The spectrum of good, better, and best practices for reducing risk associated with pest management program are as follows:

The good pest management program:

  • Establishes non-resource limiting (light, air, drainage, etc.) growing environments as a preventative cultural management strategy.
  • Practices good recordkeeping of historical pest populations and impact of pest pressure that notes injury.
  • Monitors existing pest pressure and impact of current and forecasted weather conditions to determine predict risk level and degree of intervention required to maintain visual and functional quality.
  • Implements an intervention strategy with an understanding of the environmental impact (EPA label) and the potential disruption due to damage associated with pest pressure.
  • Assesses results of intervention and annually reviews practices and products.

The better pest management program:

  • Minimizes pest importation by maintaining clean planting material (sod, seed, topsoil, etc.)
  • Establishes non-resource limiting (light, air, drainage, etc.) growing environments as preventative cultural management strategy
  • Adapts cultural practices to manage abiotic (temperature, moisture and traffic) stress
  • Practices good recordkeeping of properly diagnosed historical pest populations and images of impact of pest pressure that notes injury, damage, and objectionable reduction in visual or functional quality
  • Monitors existing pest pressure and impact of current and forecasted weather conditions to determine degree of intervention required to maintain visual and functional quality
  • Implements intervention strategy with full understanding of the environmental impact as determined by two sources (EPA, EIQ, QPRI, etc.) and commensurate with the expected level of disruption due to damage associated with pest pressure.
  • Assesses results of intervention and records a detailed a review of the practices and products.

The best pest management program:

  • Minimizes pest importation by maintaining clean planting material (sod, seed, topsoil, etc.).
  • Establishes non-resource limiting (light, air, drainage, etc.) growing environments as preventative cultural management strategy.
  • Adapts cultural practices to manage abiotic (temperature, moisture and traffic) stress.
  • Practices GIS-based recordkeeping of properly diagnosed historical pest populations and GIS-based images of impact of pest pressure that notes injury, damage, and objectionable reduction in visual or functional quality.
  • Monitors existing pest pressure and in combination with weather-based published predictive models, on-line pest population ecology, to determine degree of intervention required to maintain visual and functional quality.
  • Implements intervention strategy with full understanding of the environmental impact as determined by three sources (EPA, EIQ, QPRI, etc.) and commensurate with the expected level of disruption due to damage associated with pest pressure and impact on revenue from documented said conditions.
  • Assesses results of intervention and records a detailed a review of the practices and products including an economic cost analysis that recognizes labor, energy, and facility revenue impacts.