Pollinator BMPs: Updates!

Our stand alone publication, Best Management Practices for Pollinators on New York State Golf Courses, has been revised and republished, now available for on-line reading as a flip book: https://nygcf.com/nysgolfbmp_com/nys_pollinator_bmps_2019/.

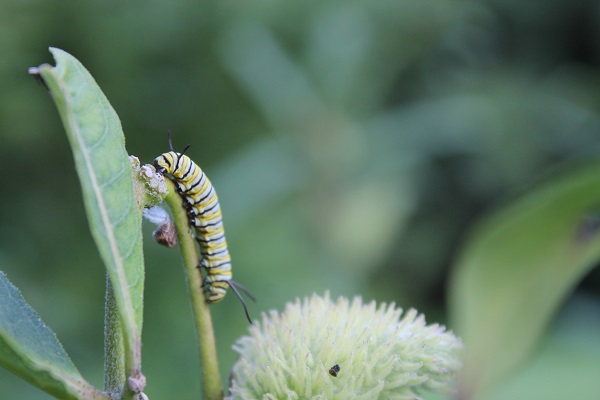
Over 400 wild species of pollinators inhabit New York State. Golf courses, especially in developed areas, can provide significant areas of habitat to support these species and domesticated honey bees as well. This publication contains the information superintendents need to protect pollinators while responsibly using  pesticides to meet their needs and guidance on providing habitat to support healthy pollinator populations.

What Good is the EIQ?

Pest management is a critical component of maintaining a playable and functional golf course. A fully implemented best management practices program demands the highest level of progressive Integrated Pest Management (IPM).

Progressive IPM observes and records pest pressure, uses predictive approaches to assessing injury risk, considers intervention with lowest environmental impact, and assesses performance of intervention for integration in pest management programs. This summer, when you consider intervention to control pests that includes the use of pesticides, consider products with the lowest environmental impact. This idea is identified in the two BMP statements:

Determine least toxic pest control programs including preventive approaches.

Recognize environmental fate of pesticides and select pesticides using a selection strategy that includes an evaluation of pesticide characteristics and potential for nontarget effects.

When pesticide use is warranted, the selection of pesticide should include an evaluation of economics, efficacy, and the environment. An additional factor such as application method should be considered as well in those cases where liquid spray is more effective than granular products or has a lower environmental impact.

A simple method to assess the reduction in environmental impact can be performed by simply calculating the pounds of active ingredients of products used and striving each year to reduce those totals. However, this simple method neglects any potential variability in toxicity, which could be accounted for by using a percentage of reduced risk or biological products for pest control.

A number of pesticide risk assessment models are available from a variety of government, university and private sources to use for more precise environmental impact estimations. These models utilize toxicity, exposure, and persistence data to provide a numerical value that integrates a number of human health and environmental impacts. For example, the Quebec Pesticide Risk Indicator (QPRI) has different assessment models for human health (QPRI-Health) and a separate number for environmental impacts (QPRI-Environment). These measure various factors and provide the user information for product selection and cumulative environmental impact during a season.

The Cornell Turfgrass Program uses the Environmental Impact Quotient developed by the NYS IPM Program and adapted for use in turfgrass systems. Like the QPRI, the EIQ assesses the toxicity for the applicator and golfer as well as environmental fate and persistence characteristics. A numerical value is determined for a product, then adjusted for field use rate and finally the treated acreage.

Both these approaches have limitations; however, over time, regardless of the tool used, it is critical to attempt to measure and monitor the risk associated with pest management programs.

An excellent example of the risk assessment approach is available in the Case Studies section of this website, in the Reducing the Environmental Impact of Pest Management case study at Soaring Eagles Golf Course. The golf course management staff at Soaring Eagles Golf Course implemented the EIQ approach over a five-year period to target reducing risk associated with pest management and specifically with dollar spot control.  The case study concluded the following:

“Soaring Eagles quickly adapted the chemical substitutions of lower FUEIQ products with the same or improved efficacies, still considering resistance management. Strategic equipment investment created opportunity for specific cultural operations that directly reduced pest pressure and improve plant vigor. Five years later, there is a 28 percent reduction in the overall FUEIQ –Acres. More significantly, the course has reduced the use of higher FUEIQ-value chemicals by 57%.”

The spectrum of good, better, and best practices for reducing risk associated with pest management program are as follows:

The good pest management program:

  • Establishes non-resource limiting (light, air, drainage, etc.) growing environments as a preventative cultural management strategy.
  • Practices good recordkeeping of historical pest populations and impact of pest pressure that notes injury.
  • Monitors existing pest pressure and impact of current and forecasted weather conditions to determine predict risk level and degree of intervention required to maintain visual and functional quality.
  • Implements an intervention strategy with an understanding of the environmental impact (EPA label) and the potential disruption due to damage associated with pest pressure.
  • Assesses results of intervention and annually reviews practices and products.

The better pest management program:

  • Minimizes pest importation by maintaining clean planting material (sod, seed, topsoil, etc.)
  • Establishes non-resource limiting (light, air, drainage, etc.) growing environments as preventative cultural management strategy
  • Adapts cultural practices to manage abiotic (temperature, moisture and traffic) stress
  • Practices good recordkeeping of properly diagnosed historical pest populations and images of impact of pest pressure that notes injury, damage, and objectionable reduction in visual or functional quality
  • Monitors existing pest pressure and impact of current and forecasted weather conditions to determine degree of intervention required to maintain visual and functional quality
  • Implements intervention strategy with full understanding of the environmental impact as determined by two sources (EPA, EIQ, QPRI, etc.) and commensurate with the expected level of disruption due to damage associated with pest pressure.
  • Assesses results of intervention and records a detailed a review of the practices and products.

The best pest management program:

  • Minimizes pest importation by maintaining clean planting material (sod, seed, topsoil, etc.).
  • Establishes non-resource limiting (light, air, drainage, etc.) growing environments as preventative cultural management strategy.
  • Adapts cultural practices to manage abiotic (temperature, moisture and traffic) stress.
  • Practices GIS-based recordkeeping of properly diagnosed historical pest populations and GIS-based images of impact of pest pressure that notes injury, damage, and objectionable reduction in visual or functional quality.
  • Monitors existing pest pressure and in combination with weather-based published predictive models, on-line pest population ecology, to determine degree of intervention required to maintain visual and functional quality.
  • Implements intervention strategy with full understanding of the environmental impact as determined by three sources (EPA, EIQ, QPRI, etc.) and commensurate with the expected level of disruption due to damage associated with pest pressure and impact on revenue from documented said conditions.
  • Assesses results of intervention and records a detailed a review of the practices and products including an economic cost analysis that recognizes labor, energy, and facility revenue impacts.

Do You Get My Drift?

Drift when it comes to pesticide applications is something to be avoided, as it can potentially cause not only water quality impacts, but also damage to susceptible off target crops. In addition, a lower than intended rate of pesticide will be applied to the turfgrass, thus reducing its effectiveness. To avoid drift, the first step is to know the difference between types: airborne (spray) drift and vapor drift.

Spray Drift

The U.S. Environmental Protection Agency defines pesticide spray or dust drift as “the physical movement of pesticide droplets or particles through the air at the time of pesticide application or soon thereafter from the target site to any non- or off-target site”. Spray drift is influenced by many inter-related factors including droplet size, nozzle type and size, sprayer design, weather conditions and the operator.

Droplet Size

Lower spray volumes can result in smaller droplets that enhance leaf coverage although there is a limit to droplet size due to drift. Droplets under 150 microns generally pose the greatest hazard; droplets less than 50 microns have insufficient momentum for impaction as they remain suspended in the air indefinitely or until they evaporate. The higher the operating pressure, the smaller the droplet. Conversely, low pressure produces large droplets that may bounce off the target. Certain spray surfactants can change the droplet spectrum, reducing the number of driftable droplets.

Nozzle Type and Size

Correct nozzle selection is one of the most important, yet inexpensive, aspects of pesticide application. A nozzle’s droplet size spectrum determines deposition and drift. Conventional flat fan nozzles fitted to a turfgrass sprayer produces droplets in the range of 10 – 450 microns. (Note: 25,000 microns = 1 inch.) Drift is a concern with droplets less than 100 microns. Increasing the Volume Median Diameter (VMD) reduces drift, but droplets that are too large bounce off the leaves to the ground.

Sprayer Design

Shields are better at targeting the spray into the grass, reducing drift and increasing deposition. They vary from the simple to the complex. Shielded sprayers allow managers to apply pesticides in variable weather conditions.

Weather Conditions

Wind speed and direction, relative humidity, temperature and atmospheric stability affects drift.

Calibration

Correct sprayer calibration ensures that all the nozzles are discharging the correct amount of liquid at the correct distance and angle to the target and at the correct forward speed.

Vapor Drift

Vapor drift is caused by pesticide volatilization – the chemical process whereby pesticide surface residues change from a solid or liquid to a gas or vapor after application. Once airborne, volatile pesticides may drift off site. Pesticide volatility varies, and not all pesticides volatilize.
The amount of vapor drift depends upon a pesticide’s volatility and atmospheric conditions such as humidity, temperature. Turfgrass pesticides with known volatility should be avoided. In some cases, the pesticide label may indicate low volatility. However, low volatility does not mean that a chemical will not volatilize under conducive conditions, such as high temperatures or low relative humidity.

Best Practices for Spraying

Before spraying:

  1. Train the operator to use the sprayer correctly.
  2. Plan the spraying operation; consider the use of spray instruction cards as a good management tool.
  3. Read and follow the pesticide label.
  4. Select the correct nozzle for the target. Adjust the size and position of the nozzles to achieve correct distribution within the grass canopy.
  5. Consider the use of sprayer nozzles which direct the spray to the target.
  6. Consider spray additives to reduce drift.
  7. Improve spraying logistics to ensure adequate time to spray within ‘ideal’ conditions.
  8. Only spray when weather conditions are ideal; avoid spraying on days when conditions are favorable for atmospheric inversion or wind drift.
  9. Calibrate the sprayer with water to ensure that everything is working correctly.

During spraying:

  1. Stay alert: ensure the spray is not allowed to drift on to non-target areas and watch for changes in wind speed and direction.
  2. Keep spray pressure as low as possible and ensure an accurate gauge is used.
  3. Maintain a constant speed and pressure. If an automatic regulator is fitted, remember, small increases in speed result in large increases in pressure.
  4. Avoid spraying near sensitive crops or watercourses; use a buffer zone.