Soil is the growing medium for turf on golf courses. Golf course superintendents must understand the behavior and function of water in the soil, as it assists with determining the potential off-site movement of fertilizers and pesticides.
Water can infiltrate into the soil and then can be held in pores or adhere to soil particles. The infiltration and water holding capacity of a soil involves different forms of energy. Three forces determine the water storage capacity of soil:
- gravitational potential, which draws water down and through the soil profile.
- matrix potential, which is defined by the adsorption of water to the soil particle surfaces. Smaller soil particles, like clay or silt, as well as organic matter, have a greater total surface area than a coarser material such as sand.
- osmotic potential, which is the attraction of water to solutes. The plant root system uses osmotic potential to draw water from the soil across the root membrane.
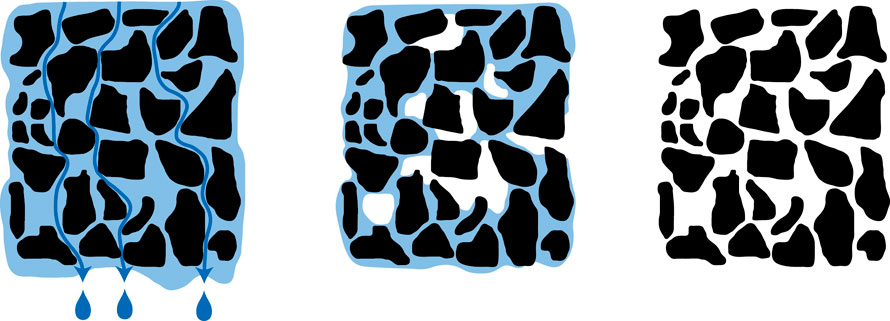
Downward movement of water through large soil pores or when soil is fully saturated is driven by gravity, hence the term gravitational water. When the soil is saturated, some of this water will become groundwater recharge or can enter drainage tiles, if present. The amount of water that remains after gravity has exerted its influence is referred to as the “field capacity” of the soil.
 Soil water field conditions: saturation (left); field capacity (middle), and wilting point (right).
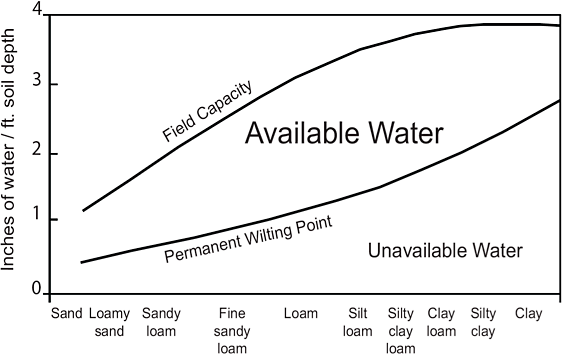
The water content of the soil determines whether plants thrive or wilt. Evapotranspiration from the turf surface draws water from the soil. If this process continues unabated and no irrigation or rainfall occurs, the soil will dry to a point known as the wilting point. The difference between soil moisture content at field capacity and the point at which plants wilt due to lack of moisture is referred to as “plant available water”. Often little plant-available water is present in the soil when it reaches the wilting point, which is the point at which the soil holds the water with greater energy force than the plant can exert to extract it.
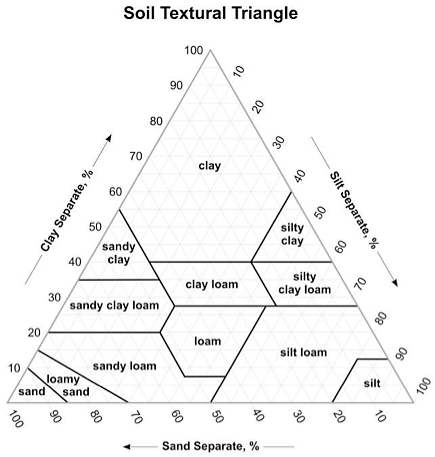
The amount of plant-available water depends upon the soil structure, texture, and organic matter. The classification of soil structure and textural analysis is shown in the soil texture triangle. Lab analysis can determine the percent distribution of sand, silt, and clay. The amount of plant-available water held by different soils is presented in the figure below. Commercially available moisture meters are able to read soil moisture percentage.

Soil textural triangle depicting soil particle distribution for different soils. Soil size definitions are as follows: Clay <0.002mm, Silt = 0.002-0.05 mm, Sand = 0.05 -2.0 mm. Source: USDA.

Available water by soil type. Source: Ohio Agronomy Guide, 14th edition, Bulletin 472-05.
Adding amendments to sand can dramatically increase the plant-available water capacity (PAWC), as shown in the table. While peat only slightly increases the PAWC of a 12-inch sand root zone, adding calcine diatomite and a natural zeolite can double or even triple the PAWC of sand.
Plant-available water holding capacity for sand and sand with amendments
| Material | Plant available water holding capacity (% by volume) |
|---|---|
| Sand | |
| Sand/Calcine clay (90:10) | |
| Sand/Calcine diatomite (90:10) | |
| Sand/Natural zeolite (90:10) | |
| Sand/peat (80:20) |
For more information on soils in New York, see http://websoilsurvey.nrcs.usda.gov.
